
Beyond the Price-Per-Pack: The Hidden Power of "Buzz-per-Buck" in Your Brewery's Bottom Line
Picture this: A customer stands in front of a craft beer cooler. They scan the price tags. They notice the labels, the ABV, and the overall brand experience your beer promises. Will your beer stand out? Or get passed over for something that feels like a better deal that offers more "Buzz Per Buck"? The difference could be your brewery's bottom line.
Here’s the kicker: it's not just about pricing high or low. It’s about pricing in a way that delivers perceived value—something drinkers sense instantly, even if they can't explain it.
Introducing: "Buzz per Buck" — The Metric That Could Transform Your Pricing Strategy
Let’s be clear: consumers aren’t standing in the store calculating price per ABV.
But their brain is.
Subconsciously, consumers are doing a quick gut check:
How much am I paying?
How strong is this beer?
How will it feel for the price?
That intuitive value scan is what we’re calling “Buzz per Buck.” It’s not a scientific formula—it’s a tool for brewers to understand the felt value behind customer decisions.
We’re looking at:
ABV per liter
Price per liter
Perceived experience (strength, taste, reputation, reward)
Even if drinkers don’t or can’t articulate it, they can feel when something’s worth it—or not.
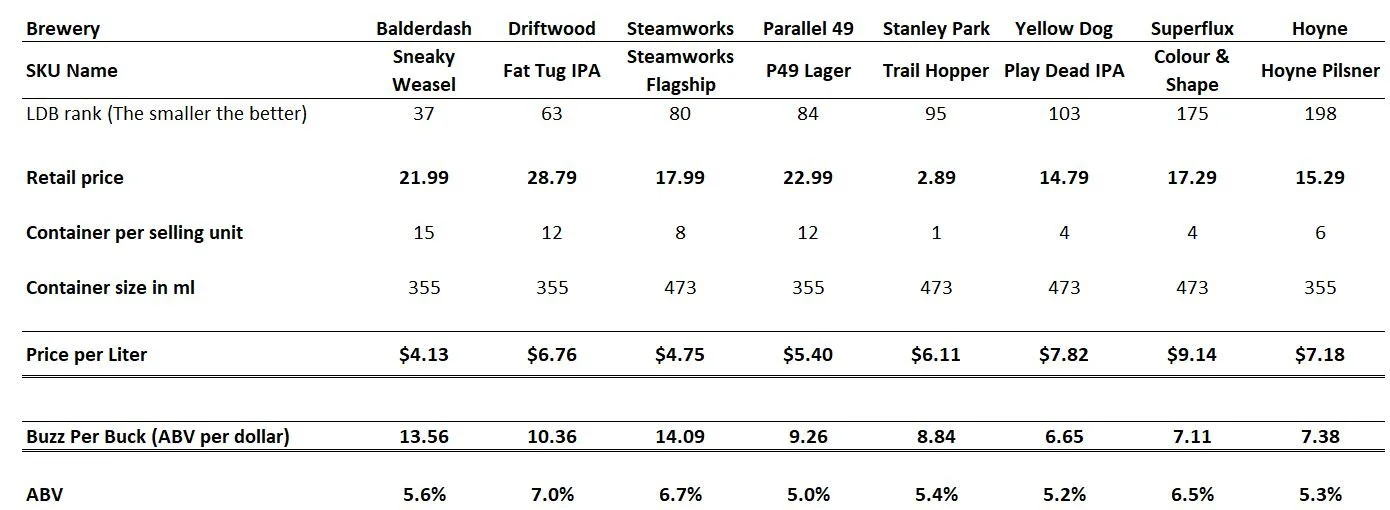
Case Study: 8 BC Craft Beers Compared by Value and Sales Rank
Let’s be clear: there are dozens of factors that go into pricing a beer—and many of them aren’t visible on the shelf.
A higher retail price might reflect:
Branding strategy (targeting premium drinkers)
Ingredient like premium hops, imported malts, or unique flavouring
Custom yeast strains or time-intensive techniques (like barrel aging or double dry hopping) take skill and time
Production scale (smaller batches = higher unit cost)
Packaging choices (high end labels, custom boxes)
All of these influence price—but they’re business decisions made behind closed doors.
So for this analysis, we stripped it down to just three public data points:
Retail price
Alcohol content (ml of pure alcohol per $1 spent)
Top 200 Best selling beers from the BC Liquor Distribution Branch (1)
Think of this as a tool—not a verdict.
It’s about exploring how pricing and ABV might influence shelf performance. It’s a pure comparison of perceived value: What am I paying, and what am I getting in the context of Value-Per-Dollar? This isn’t about judging quality or business decisions.
Here’s how eight well-known SKUs stack up [2]:
If you're a brewery mentioned in this article and would like to discuss or request changes, feel free to reach out. This piece is meant to spark conversation and insight—not critique.
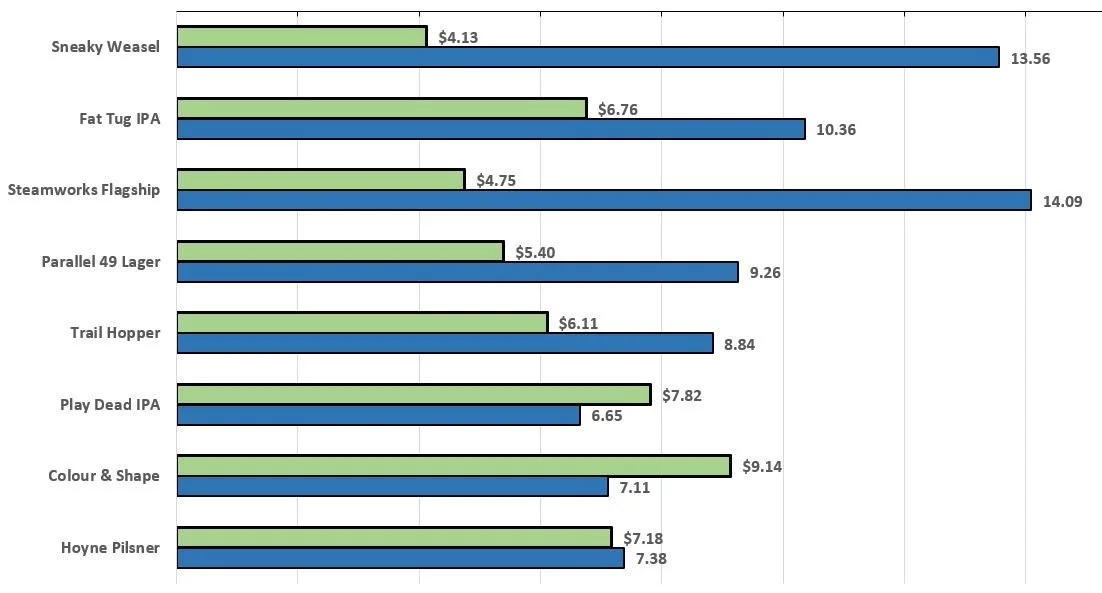
Legend for the Chart
Green: Price per Liter
Blue: “Buzz Per Buck score” (ml of Alcohol Per Dollar)
What the Numbers Show:
Steamworks Flagship is Delivering High Value
At $4.75 per liter with a Buzz-Per-Buck score of 14.09, Steamworks Flagship offers high value—and consumers are responding. It ranks #80 in the LDB sales.
What that suggests: It’s priced competitively, offers decent strength, and consumers feel like they’re getting a good deal. It’s a great example of how striking the right balance drives results.
Sneaky Weasel Leads in Affordability
With a price of $4.13 per liter and a Buzz-Per-buck ratio of 13.56, Sneaky Weasel ranks #37 on the LDB list.
What that suggests: There’s a large segment of drinkers responding well to affordability with a punch (affordability and craft beer appeal can coexist). That kind of positioning doesn't require trendiness—it just works.
⚠️ While larger formats like 15-packs of 355ml cans can enhance perceived value, breweries should be aware of the margin implications. These formats typically yield lower margins due to increased packaging costs and volume discounts. Though the lower price per liter strengthens the value proposition, it's critical to analyze potential margin dilution, as incremental volume doesn't always equal incremental profit.
Premium price, Smaller Pour
Beers like Yellow Dog Play Dead IPA, Superflux Colour & Shape, and Hoyne Pilsner sit in the $7.18–$9.14 per liter range with lower Buzz-per-Buck scores.
What that suggests: these beers target niche drinkers that prioritize quality, unique flavour profiles, and the overall craft experience. Their pricing strategy reflects a focus on delivering a premium product, rather than competing on 'Buzz per Buck'. The challenge is making that niche feel “worth it” to the right buyer.
Price ≠ Perception of Quality
The best-selling beers in BC aren’t always the strongest, the cheapest, or the coolest. They’re the ones that hit that invisible line where strength, price, and trust meet.
If your 4x473-pack is:
High price per liter
Lower ABV
Not clearly positioned as “worth it” on taste or experience
Then it may get passed over—even if it wins awards.
🎯 How to Use This in Your Own Brewery
Ask these key questions for each SKU you’re producing:
✅ What’s our price per liter, and how does it compare to competitors on the shelf?
✅ Are we delivering a "Buzz per buck" that consumers can feel?
✅ Where do we sit on the LDB top 200? Are we trending up or down?
And if you're launching something new:
✅ Can we punch above our price point with format or formulation?
What You Can Do With This “Buzz per Buck” Insight:
Competitive Benchmarking
“This SKU delivers 11% more ABV per dollar than the closest competitor.”
SKU Optimization
Should you tweak ABV?
Would you benefit from resizing your beer to hit a more competitive price point?
Could you reposition certain SKUs into a stronger-performing category?
Better Retailer & Investor Pitches
Use language they care about: performance, value, momentum. Show them the numbers that matter.
Ready to See Where Your SKUs Stand
You don’t need a rebrand or a full portfolio overhaul to improve shelf performance. Sometimes the unlock is right there in your ABV, price point, and pack format—based on the same numbers your customers are already reacting to.
I help breweries:
Benchmark SKUs against peers using wholesale data
Spot pricing gaps and value blind spots
Build pricing strategies that align with brand and buyer instincts
Run pricing elasticity models to see if you're leaving money on the table
Let’s Talk – I’d Love to Hear from You
Want a quick value snapshot of your top sellers? I’ll run a custom SKU breakdown—no pitch, just insight. If it sparks something, maybe we grab a pint and dive deeper.
Written by Sean Wang, Founder | Beer Lover | Mountain Biker
Updated Apr 14, 2025
🍻 First round’s on me.
[1] source: https://wholesale.bcldb.com/resources/product-information. BCLDB publishes the top 200 selling SKUs at the end of each financial quarter. Report date range: Dec 29, 2024 - Mar 31, 2025
[2] The price comparisons in this article are based on publicly available data from the BC Liquor Distribution Branch. Prices may vary depending on location and promotional offers.
Disclaimer
This analysis is for illustrative purposes and does not constitute an endorsement or criticism of any specific beer or brand. It’s offering insight into how their beer might appear to a consumer—not how good or bad it is. Breweries that are strategic might welcome the insights.