Case Study: How a B.C. Craft Brewery Unlocked Hidden Profits by Rethinking Their Pricing
This case study details how The Great Grind Brewing Co., a craft brewery in British Columbia, transitioned from a volume-focused approach to a profit-driven strategy by implementing SKU-level pricing analysis. Despite strong sales and distribution, the brewery faced declining margins. By analyzing price sensitivity and SKU performance, they identified opportunities to optimize pricing, resulting in improved profitability and a clearer strategic direction. This approach provides a roadmap for other breweries and businesses seeking to maximize profitability through data-driven pricing strategies.
The Challenge: The Illusion of Success
The Great Grind Brewing Co. enjoyed many hallmarks of success:
Exceptional product quality
High taproom traffic
Broad distribution across BC Liquor Stores
But behind the scenes, the numbers didn’t add up.
“We were moving product, but we weren’t making money. It felt like we were just spinning our wheels”
Like many growing breweries, they’d been pricing their beer based on gut feeling and what competitors were doing. As the number of SKUs grew and costs rose, margins quietly eroded. The business was scaling — but profit wasn’t.
The Solution: Zooming In — One Beer at a Time
We stepped in to bring structure, clarity, and strategy to their pricing.
Instead of broad strokes, we took a SKU-level approach — analyzing volume, revenue, margin, and price sensitivity (elasticity) over time. Our goal: uncover where profit was hiding… and where it was leaking.
Key questions we tackled:
Which beers are carrying the business?
Which ones are quietly losing money?
Where can we raise prices without killing demand?
This approach enabled The Great Grind Brewing Co. to move beyond guesswork and make informed, data-backed pricing decisions. The analysis focused on two key areas:
Elasticity: How sensitive is demand to price changes?
Correlation: When prices went up or down, did sales follow?
The Results: Clear Priorities, Smarter Pricing, and Stronger Profit
The analysis revealed significant insights:
Overall Business Trends (Year 4 vs. Year 1) – sales were holding. Profit wasn’t
Revenue up 1.7%
Volume down 5.3%
Margin down 6.8% (this is the red flag)
What's Happening at the SKU Level
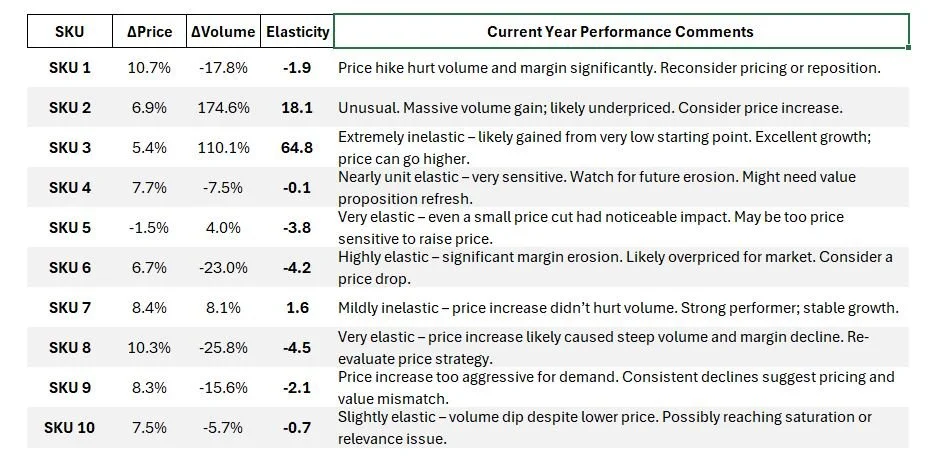
📈Top Performer: SKU 7
Makes up 34% of volume, 38% of revenue, and 37% of margin.
Sales kept growing even as prices increased.
Action: Continue supporting and test small price lift, but watch for sensitivity
🚀 Future Stars: SKU 2 and 3
Explosive growth: up 175% and 110% in volume respectively
Customers show little-to-no price sensitivity
Action: Ran simulations, tested new price points — early results show volume held while margin improved. Support these with light marketing.
👀 Products to Watch
SKU 1 dropped in volume after a price hike. Still a top seller, but too sensitive to push further.
SKU 8 used to be strong, but now sales and profit are sliding — price might be too high.
SKU 5’s sales are growing, but profits are shrinking — costs or discounts could be creeping in.
Action: Hold pricing steady for now, and review cost structures.
📉 On the Decline: SKU 6
Falling fast in both sales and profit. High price sensitivity
Action: Either re-evaluate positioning or consider dropping it altogether.
The Strategic Lens: Where Can We Safely Raise Prices?
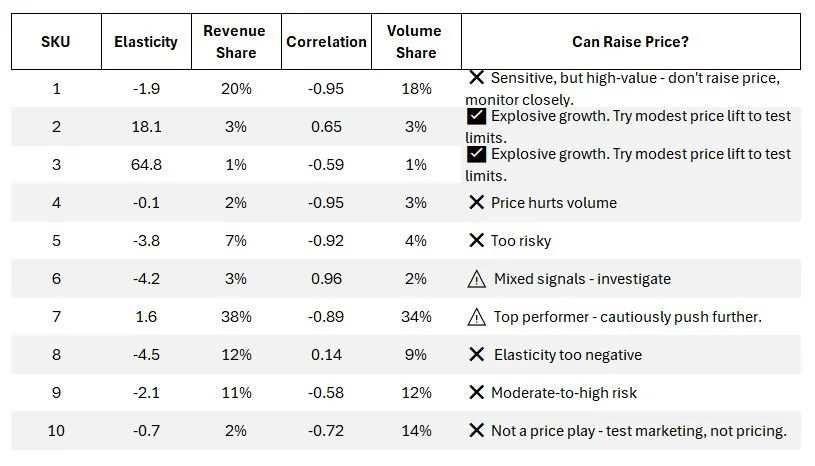
We built a SKU pricing matrix based on four factors:
Elasticity, Revenue Share, Volume Share, and Historical Correlation (Price vs. Sales) so you can make data-backed decisions for each SKU — maximizing margin without losing your top sellers.
This helps answer questions like:
Which SKUs are worth investing in?
Which ones might be overpriced and scaring off customers?
Are there hidden gems growing quickly but still small?
Should any underperformers be dropped or repositioned
“Elasticity:
How demand responds to price changes. Lower than -1? Price up = big drop in sales. Near 0? Customers don’t really react. Positive? More demand with higher price ( Weird. Rare.”
“Correlation:
Historical pattern. If it’s close to -1, higher price = fewer sales. Close to 0? No clear link. Positive? Maybe more price = more sales (rare, might be promo effect).”
🟢 Recommended SKUs for Price Increase Testing:
SKU 2: Elasticity is very positive, correlation is positive → test a price increase on this small but stable SKU.
SKU 7: Elasticity says price increase is okay, but correlation suggests volume could drop. Test carefully.
⚠️ SKUs to Watch or Dig Deeper:
SKU 3: Elasticity looks crazy high — check for data error or promo effects. Strong growth — test price but monitor for volume sensitivity.
SKU 6: Elasticity says "don’t raise price", but correlation is positive — The correlation might reflect a niche or one-offs (e.g. promotion), but elasticity and performance both say it’s failing.
❌ SKUs You Shouldn’t Raise Prices On (for now):
SKU 1, 4, 5, 8, 9, 10 — These all have strong negative elasticity and negative or weak correlation, meaning price increases almost certainly hurt sales.
SKU Roadmap and Performance Analysis:
We built a SKU roadmap to guide product management, marketing, and pricing decisions. This analysis evaluated individual SKU performance over time, based on volume, revenue, margin, and price sensitivity.
The Impact: From Confusion to Clarity and Profitability
By moving from a reactive, gut-based pricing approach to a proactive, data-driven strategy, The Great Grind Brewing Co. achieved the following:
Clarity: A clear understanding of SKU-level performance and profit drivers.
Confidence: Data-backed insights that enabled informed decision-making.
Profitability: Optimized pricing strategies that improved margins without sacrificing volume.
Specifically, the brewery focused on:
SKU 7: Maintained stable pricing due to its importance, while closely monitoring price sensitivity.
SKU 2 and 3: Implemented price increases, leveraging their high growth and low price sensitivity. Early results confirmed that volume remained steady, and margins improved.
Want to See What’s Hidden in Your Pricing?
This kind of deep-dive isn’t about spreadsheets for the sake of it. It’s about finding out which products are growing your business — and which ones are quietly dragging it down.
When you know where to focus, you can price smarter, promote better, and grow profit without guessing.
If this sparked ideas or made you rethink your pricing structure, just imagine what we could do over a pint.
Whether it’s dialing in margins, refining pricing, or just bouncing around ideas — I’m here for it.
Written by Sean Wang, Founder | Beer Lover | Mountain Biker
Disclaimer: The company and data presented in this case study are fictitious and used for illustrative, entertainment, and educational purposes only. Any resemblance to real companies or data is purely coincidental.


